Observability for generative artificial intelligence in Microsoft Foundry focuses on making systems measurable, understandable, and debuggable across the entire application lifecycle. Teams collect evaluation metrics, logs, traces, and model outputs to gain visibility into performance, safety, and operational health, with the goal of preventing inaccurate, poorly grounded, or harmful responses. The Microsoft Foundry SDK for evaluation and the Foundry portal are in public preview, while the underlying evaluation APIs for models and datasets are generally available, and agent evaluation remains in public preview.
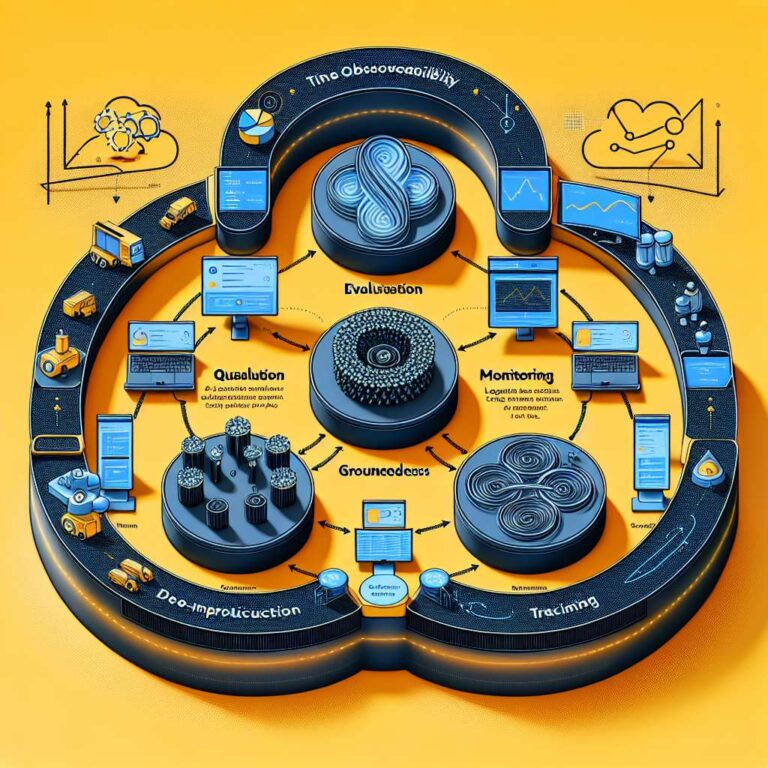
Microsoft Foundry’s observability offering is organized around three core capabilities: evaluation, monitoring, and tracing. Evaluators measure quality, safety, and reliability of artificial intelligence responses, including general metrics such as coherence and fluency, retrieval augmented generation metrics such as groundedness and relevance, safety and security checks such as hate or unfairness, violence, and protected materials, and agent-specific metrics such as tool call accuracy and task completion, with options to build custom evaluators. Production monitoring, integrated with Azure Monitor Application Insights, provides real-time dashboards for operational metrics, token consumption, latency, error rates, and quality scores, and enables alerts when outputs fail quality thresholds or produce harmful content. Distributed tracing, built on OpenTelemetry and integrated with Application Insights, captures the flow of large language model calls, tool invocations, agent decisions, and inter-service dependencies, and supports frameworks including LangChain, Semantic Kernel, and the OpenAI Agents SDK.
Evaluation is framed across three stages of the artificial intelligence application lifecycle: base model selection, pre-production evaluation, and post-production monitoring. During model selection, teams compare quality, task performance, ethics, and safety across models using the Microsoft Foundry benchmark and the Azure AI Evaluation SDK. In pre-production, agents and applications are tested against evaluation datasets and edge cases, with metrics such as task adherence, groundedness, relevance, and safety, using bring-your-own-data evaluations, the Foundry evaluation wizard or SDK, and an artificial intelligence red teaming agent based on Microsoft’s PyRIT framework for adversarial testing with human-in-the-loop review. After deployment, continuous monitoring covers operational metrics, sampled production traffic evaluation, scheduled dataset-based evaluation to detect drift, and scheduled red teaming, with Azure Monitor alerts and a Foundry observability dashboard that consolidates performance, safety, and quality insights.
A structured evaluation “cheat sheet” guides teams through configuring distributed tracing, selecting or building relevant evaluators, uploading or generating datasets, running local or remote evaluation runs, and analyzing results. Capabilities include cluster analysis of evaluation failures, monitoring dashboard analysis, and an agent optimization playbook that recommends updating agent instructions, improving tool success rates, applying targeted mitigations, upgrading underlying models, saving as new versions, and re-evaluating. Region support, rate limits, and virtual network support determine where artificial intelligence assisted evaluators can run and how to achieve network isolation. Observability features such as risk and safety evaluations, continuous evaluations, and evaluations in the agent playground are billed based on consumption as listed in the Azure pricing page, and evaluations in the agent playground are enabled by default for all Foundry projects unless users explicitly turn off all evaluators in the playground metrics settings.